January 2026
How U.S. World Cup 2026 Host Cities Can Use Maps to Drive Tourism and Economic Impact
A guide for host cities to leverage custom maps for tourism and economic development
The U.S. is heading into one of the largest tourism moments in its history. The 2026 World Cup will bring matches to 11 U.S. host cities, but the impact won’t stop at city limits. Regions, suburbs, and neighboring destinations are all likely to see a surge in visitors as fans travel between matches, look for accommodations outside core metros, and explore nearby attractions.
According to Tourism Economics, the tournament is expected to bring 1.2 million international visitors to North America. These travelers are projected to stay an average of 12 days, attend two matches, and spend more than $400 per day. That level of movement creates ripple effects across entire regions — not just stadium districts.
Cities like Philadelphia, Boston, and New York are already seeing headlines projecting billions of dollars in economic impact, but much of that spending will flow into surrounding towns, regional attractions, and secondary cities connected by rail or road.
Maps play a critical role in shaping where that spending goes.
PamPam is an AI map maker that helps you make your own custom maps. You can make interactive maps, travel maps, and simple map animations in seconds, all designed to look beautiful and easy to share. For World Cup planning, maps help visitors understand not just where matches are held, but what’s worth exploring beyond them.
You can explore World Cup maps here:
https://www.pampam.city/world-cup-2026-maps
Or create your own event-focused maps here:
https://www.pampam.city/event-map
Below are ways host cities and surrounding regions can use maps to drive tourism and economic impact during the World Cup.
The scale of the opportunity extends beyond host cities
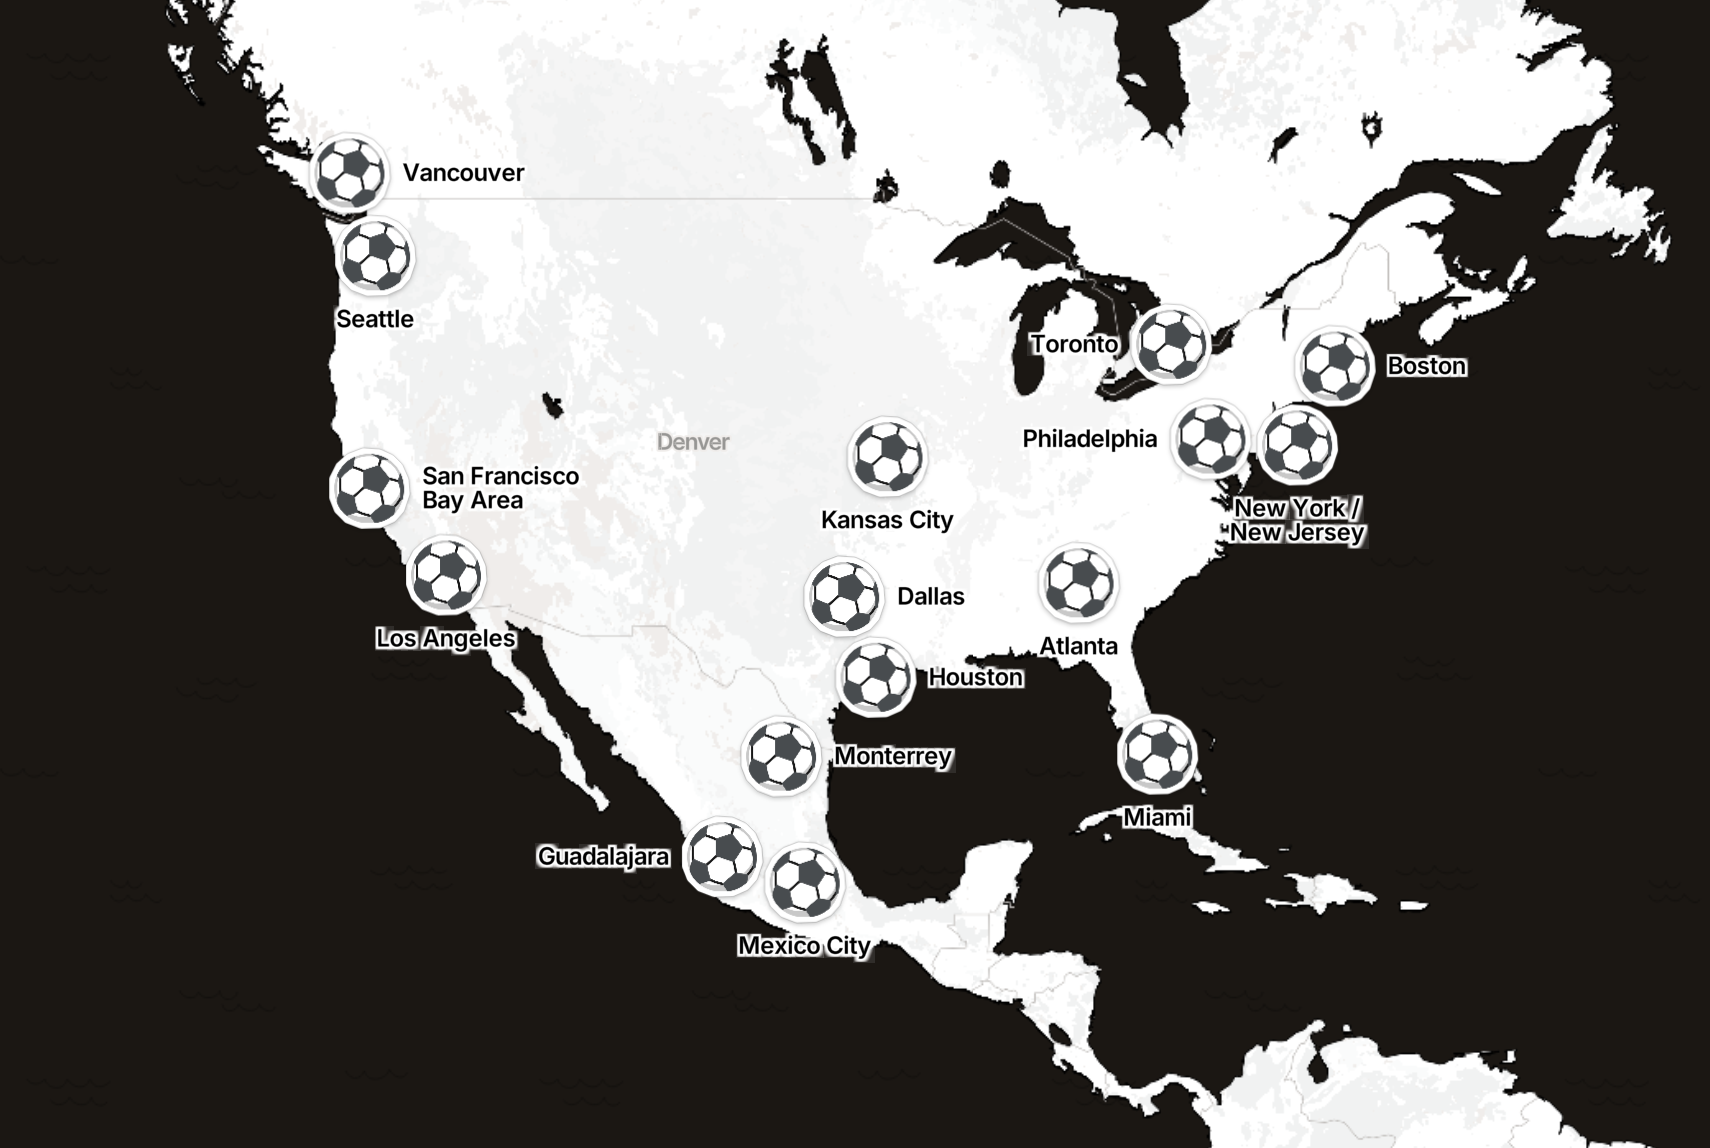
The 2026 World Cup runs from June 12 to July 19, with 78 matches across 11 U.S. metro areas: Atlanta, Boston, Dallas, Houston, Kansas City, Los Angeles, Miami, New York/New Jersey, Philadelphia, the San Francisco Bay Area, and Seattle.
Tourism Economics expects the event to help reverse a 6.3% decline in international visitors in 2025, forecasting 3.7% growth in 2026, driven in part by World Cup travel.
FIFA and the World Trade Organization estimate the tournament will generate billions of dollars in economic activity, boosting hospitality, transportation, and retail — while positioning U.S. regions as global destinations.
Visitors won’t only stay downtown. Many will book hotels in nearby towns, visit regional attractions, and explore places within an hour or two of match venues.
Help visitors explore the wider region
Fans traveling internationally often want more than stadium access. They’re looking for experiences: food, nature, culture, and local character.
Maps can guide that exploration across an entire region.
Tourism organizations can create maps that highlight:
- Neighborhoods near stadiums
- Nearby towns and suburbs with hotels
- Day-trip destinations and scenic routes
- Regional dining corridors and cultural sites
- Parks, beaches, wineries, and historic districts
When this information lives on a map, visitors can see how places connect — not just where they are.
Encourage travel between cities and regions
With visitors staying nearly two weeks on average, many will move between host cities or explore surrounding areas in between matches.
Maps can make that movement easier.
Cities and regional tourism boards can create:
- Rail and driving routes between host cities
- Multi-day regional itineraries
- “Stay nearby” hotel and lodging maps
- Travel corridors connecting stadiums to regional attractions
This encourages fans to spread their time — and spending — across a broader area.
Let visitors personalize their plans
Static guides are helpful, but interactive maps are more powerful when visitors can adapt them.
With PamPam, tourism boards can publish maps that fans can view, share, or copy. A visitor can duplicate a regional guide and add:
- Their hotel or Airbnb
- Saved restaurants and cafés
- Attractions they plan to visit
- Stops between cities
This turns a tourism map into a living trip plan, used before and during the visit.
Embed maps where visitors are already looking
World Cup travelers will discover information through many channels: tourism sites, event pages, partner hotels, and social media.
PamPam maps can be embedded directly into:
- City and regional tourism websites
- World Cup microsites
- Stadium and transit guides
- Partner and hotel pages
Updates happen instantly across all embeds, which is critical during a fast-moving event.
Use maps across digital, social, and print
Maps don’t have to live in one place. Tourism teams can export images or create simple map animations for:
- Social media campaigns
- Video explainers for regional travel
- Digital signage in airports and hotels
- Visitor guides and press materials
A single map can support many channels, helping visitors understand the region visually and quickly.
Turning global attention into regional impact
The 2026 World Cup will place U.S. host cities — and their surrounding regions — on a global stage. The opportunity is not just to host matches, but to invite visitors to explore more widely and stay longer.
Clear, well-designed maps help visitors move confidently, discover nearby destinations, and engage with local businesses beyond the stadium zone. They turn awareness into exploration, and exploration into economic impact.
PamPam’s tools are designed to support that scale — from city cores to neighboring towns and regional destinations.
Explore World Cup maps here:
https://www.pampam.city/world-cup-2026-maps
Create an event map for your city or region here:
https://www.pampam.city/event-map
We’d love to see how you’re using maps to welcome visitors in 2026 — wherever they choose to explore.